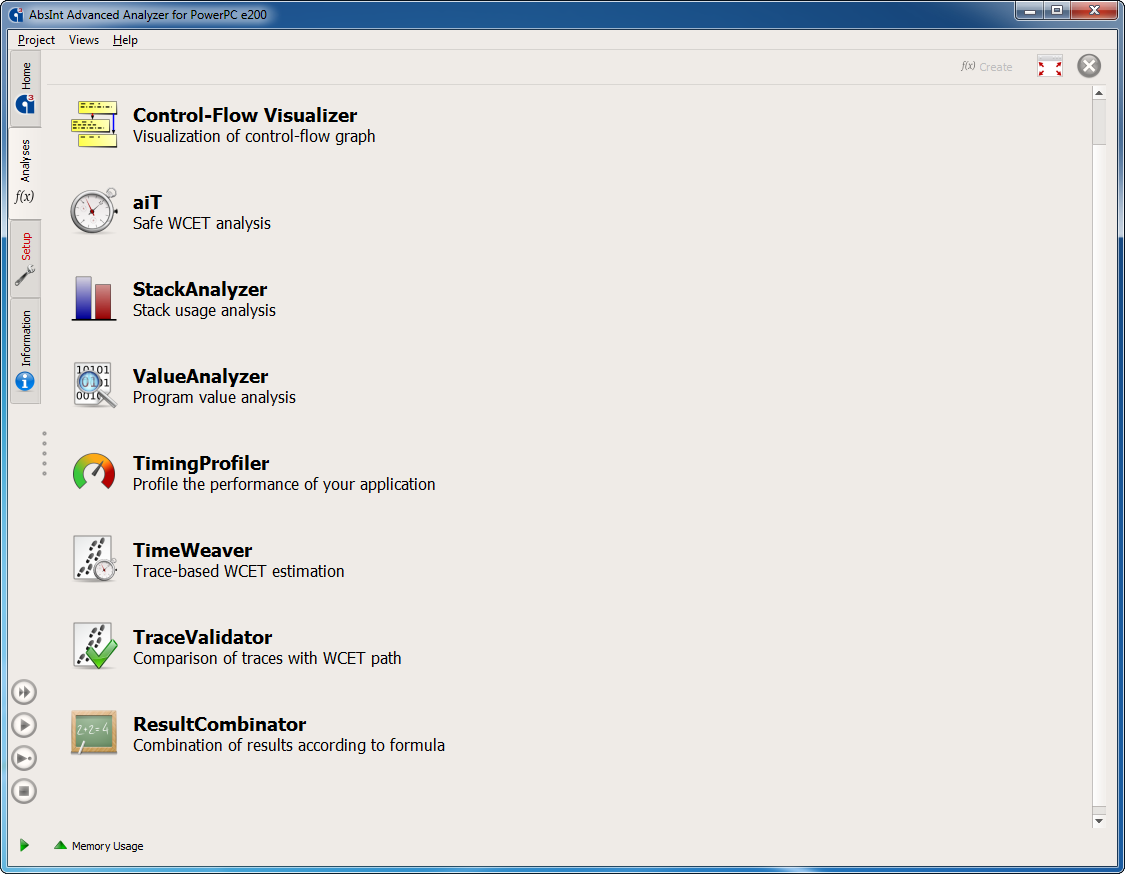
StackAnalyzer can be combined with other static program analyzers from AbsInt in a single intuitive user interface.
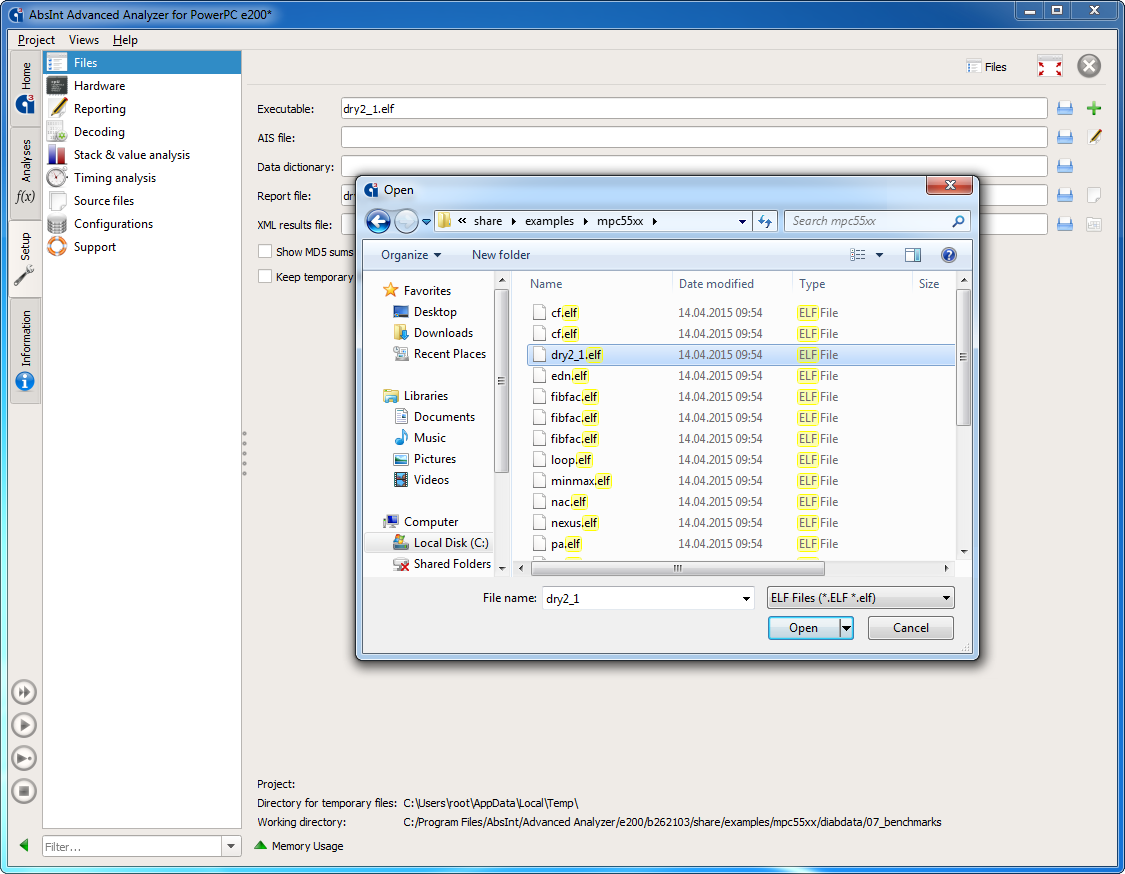
Configuration screen: selecting files for analysis. StackAnalyzer directly analyzes binary executables, exactly as they are executed in the final system.
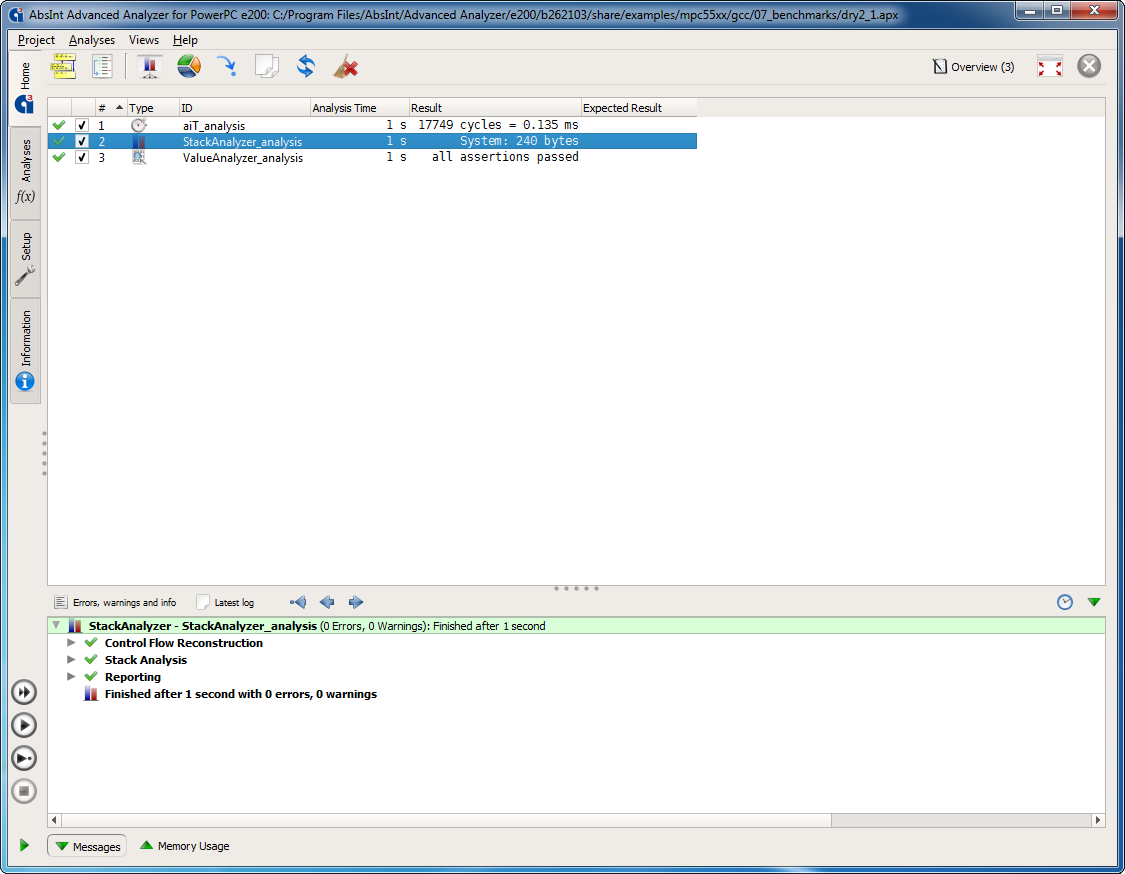
Analysis results: the maximum stack usage is shown in bytes. The results are valid for all inputs and each task execution. StackAnalyzer automatically considers all possible execution scenarios.
Double-clicking on the analysis results opens the call graph of the analyzed application.
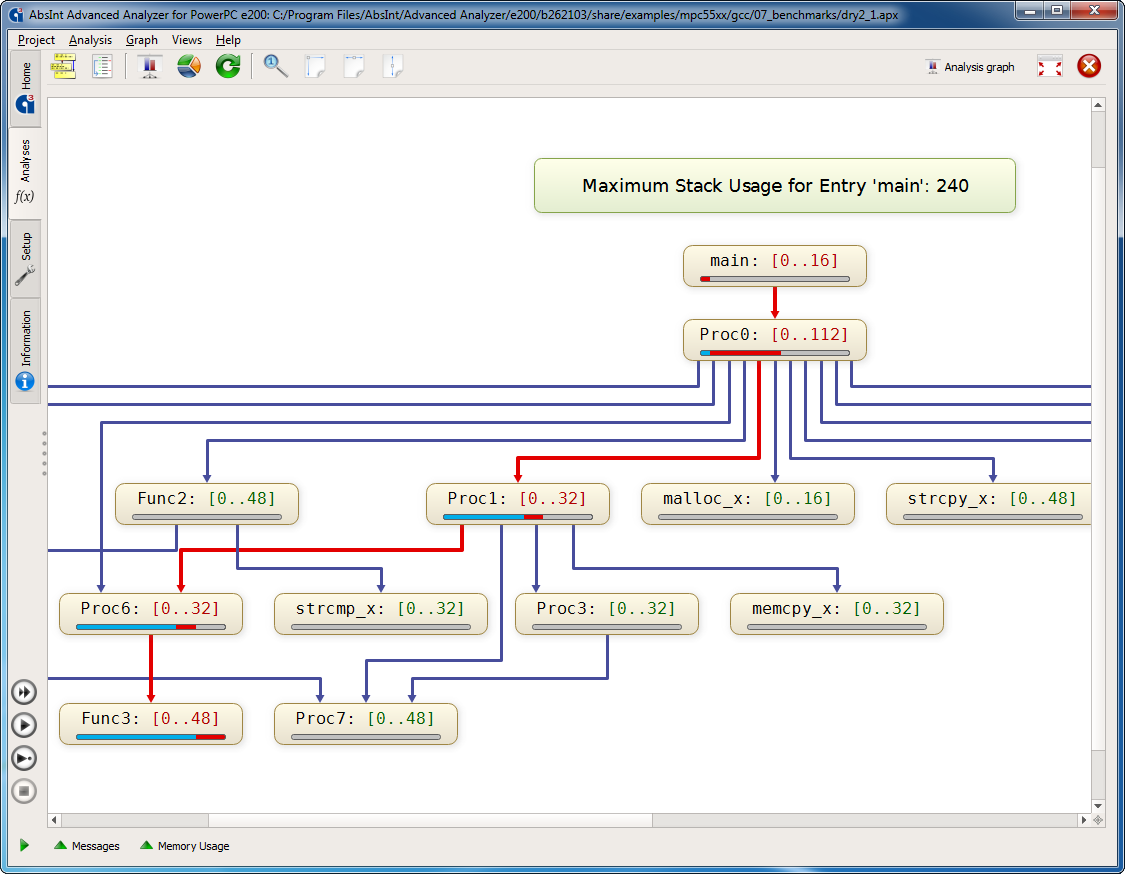
Call graph with stack usage analysis results. All routines are annotated by their worst-case stack usage. Critical program sections are highlighted.
Each routine can be interactively unfolded to further inspect the control flow within it.
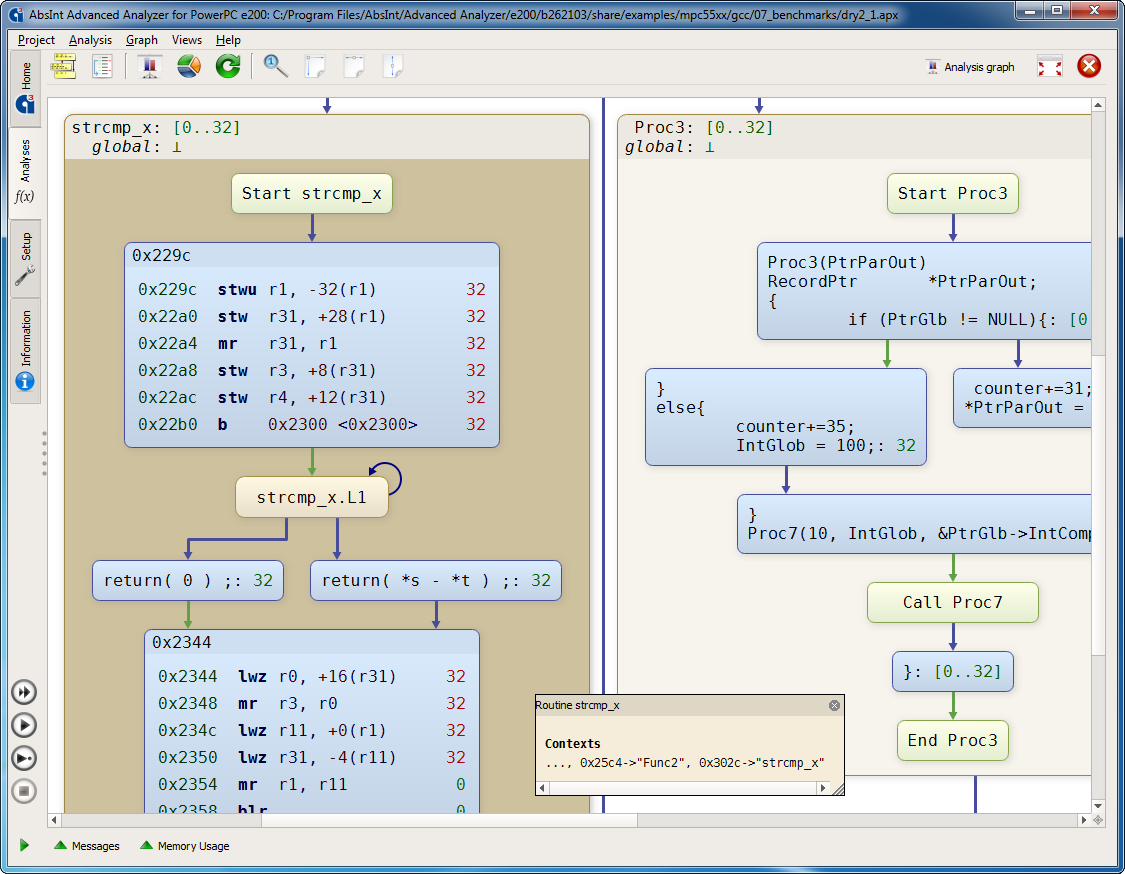
In the control flow graph, all basic blocks and instructions are annotated by their worst-case stack usage, so you can investigate your application’s behavior at any desired level of detail.
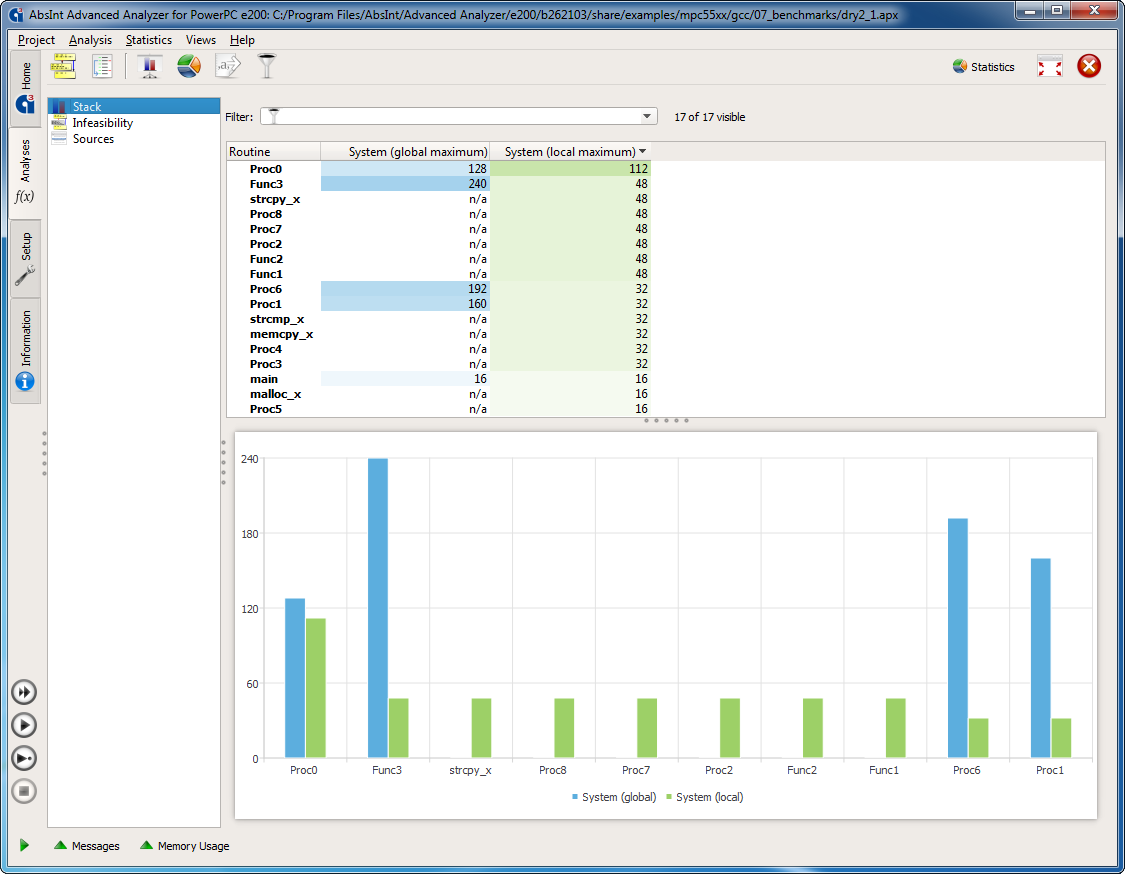
In addition to the detailed graphs, tabular and chart overviews of the analysis results are available.
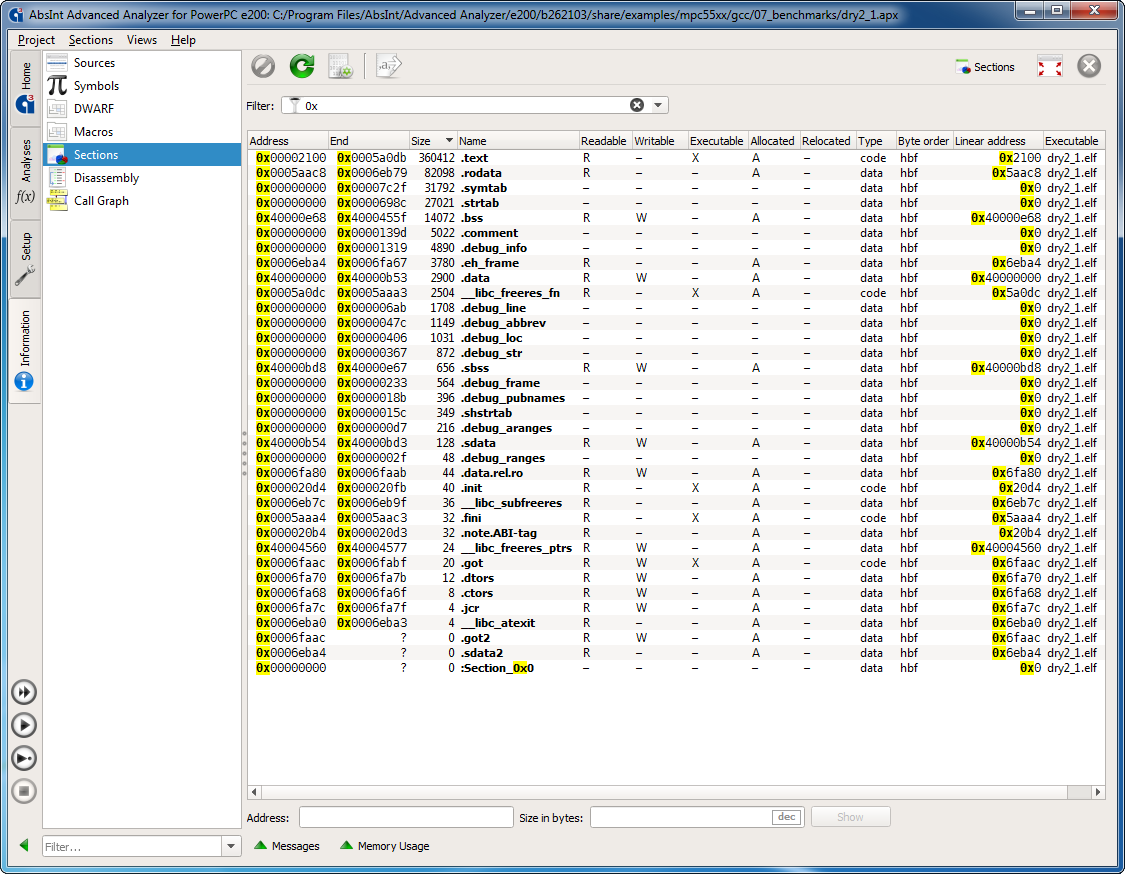
Various other views provide an even deeper insight into the workings of your software. For example, the Sections view allows you to view all sections of the binary and inspect their content like in a hex editor. It also enables you to find out the memory content for a given address area.
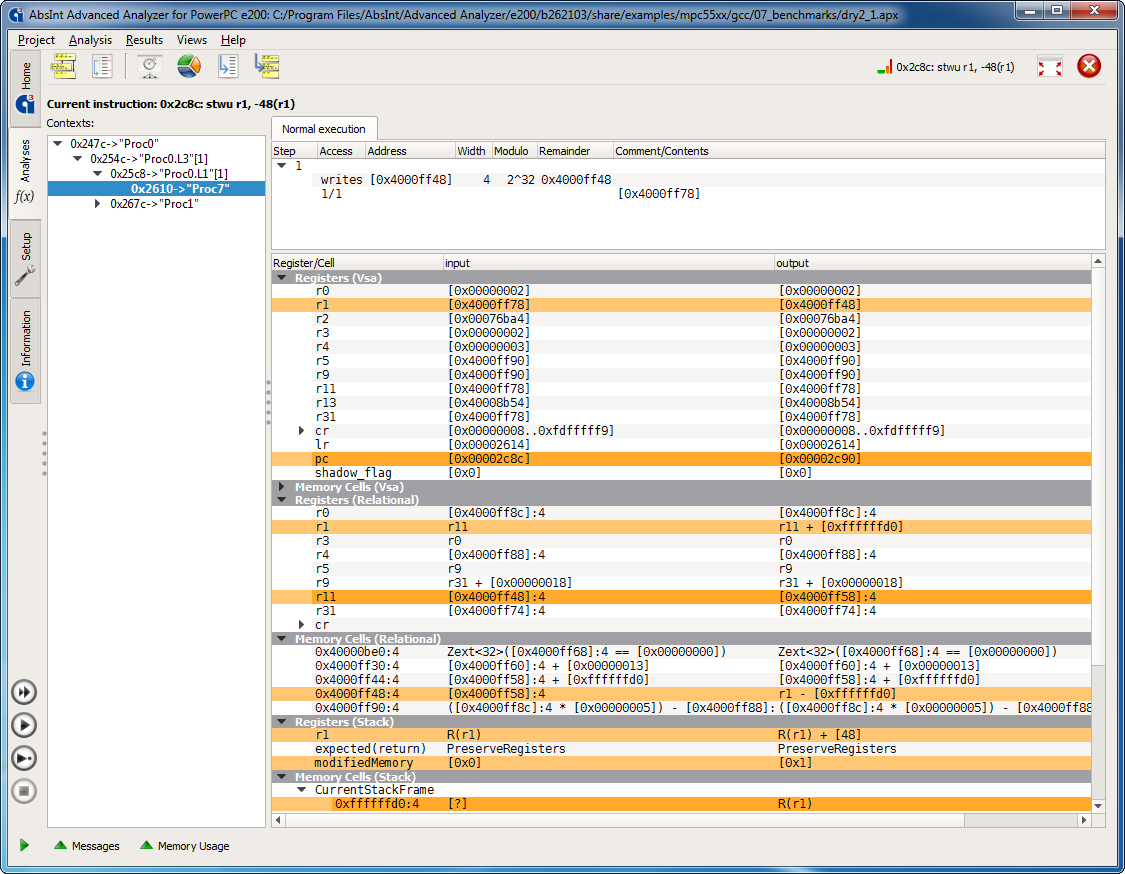
An optional ValueAnalyzer add-on lets you inspect the contents of all registers and memory cells at any program point in any execution context.
- Watch a 15-minute StackAnalyzer demo on our YouTube channel.
.jpg)