StackAnalyzer automatically determines the worst-case stack usage of the tasks in your application. It lets you find any stack overflows, or formally prove the absence thereof.
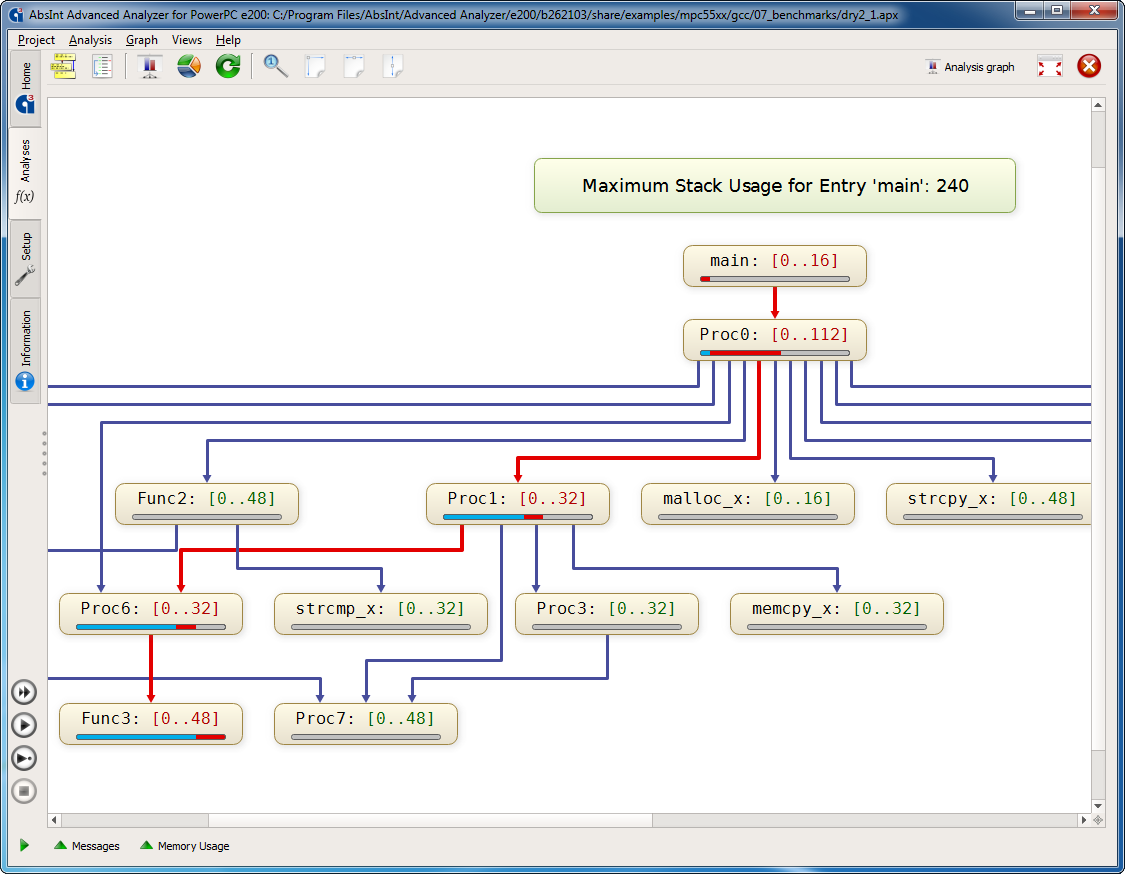
Call graph with stack usage and worst-case path
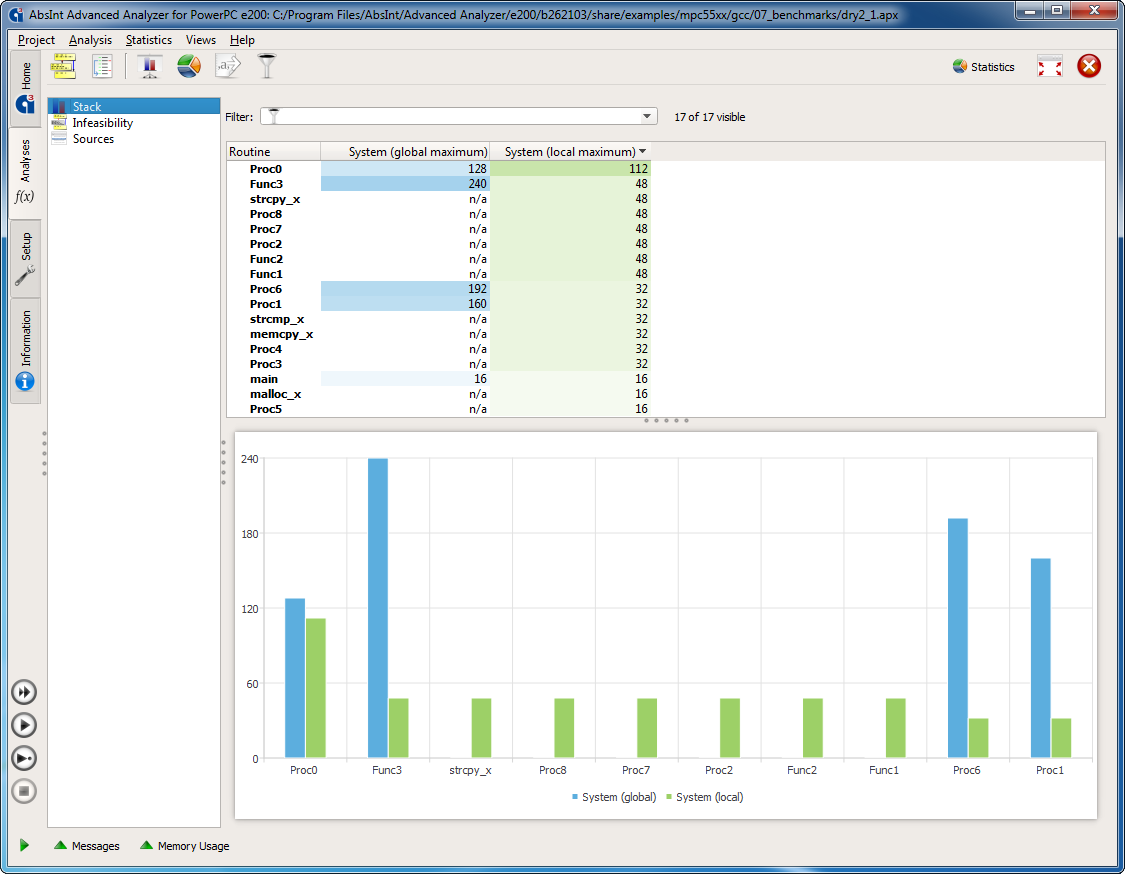
Tabular and chart summaries of the analysis results
Features
- Precise, clear, and detailed information on user-stack usage and system-stack usage by application tasks.
- Freely selectable entry points for the analysis. You can easily focus on any code parts of particular interest to you.
- Control-flow reconstruction directly from binary code. Potential flaws in the debug information will not confuse StackAnalyzer.
- Fully integrated, feature-rich graphical and textual viewers for control flow, analysis results, source code, assembly code, DWARF debug info, symbol tables, configuration files, and more.
- Customizable XML reports for documentation and certification.
- ValueAnalyzer add-on for static analysis of register and memory cells, memory accesses and function calls.
- Seamless integration with other analysis tools from AbsInt (e.g. aiT for worst-case execution time analysis).
- Batch mode for easy integration with other tools and into automated build processes.
- Qualification Support Kits for ISO 26262, DO-178B/C, and other safety standards.
Who uses StackAnalyzer?
Airbus France, in the development of safety-critical avionics software for several airplane types, including the A380.
Daimler, in many automotive software projects, including the powertrain control system of the Actros line.
Honda, in developing the FADEC software of a turbofan engine.
Vestas, to prevent stack overflow in their wind turbine control software.
Framatome, for verification of their safety-critical platform for testing, operating and troubleshooting nuclear reactors.
Continental, to avoid stack overflows in their airbag control systems.
OHB, in the development of onboard software for satellite platforms for communication and navigation.
u-blox, to avoid stack overflows at compile time and to increase the reliability of their controlling software.
MTU Friedrichshafen, to demonstrate the correctness of control software for emergency power generators in power plants.
Your benefits
- StackAnalyzer reduces the development effort and helps prevent runtime errors due to stack overflow.
- StackAnalyzer calculates the stack usage automatically. No testing or measuring required. The analysis results are valid for all inputs and any task execution.
- StackAnalyzer directly analyzes binary executables, exactly as they are executed in the final system.
- Using StackAnalyzer is essential in meeting current safety standards such as ISO 26262, DO-178B/C, IEC-61508, and EN-50128, where statically analyzing the stack usage is part of the architectural safety requirements.
Supported targets
StackAnalyzer is available for a wide and ever-growing array of target processors and compilers.
Seamless integration into your toolchain
StackAnalyzer supports tight integration with state-of-the-art development tools, including:
- SCADE Suite, the market-leading embedded-software development environment from ANSYS
- TargetLink, the production-code generation tool from dSPACE
- SymTA/S scheduling analysis tools from Symtavision/Luxoft
- Jenkins, the leading open-source automation server
- RT-Druid, the Eclipse-based development environment from Evidence
“When searching for actual products performing stack usage analysis for embedded software, StackAnalyzer seems to be the most promising (and probably only) choice.”
Independent review by University of Erlangen
Qualification support
Your usage of StackAnalyzer can be qualified according to ISO 26262, DO-178B/C, and other safety standards. We offer special Qualification Support Kits that simplify and automate the qualification process. These Kits have been successfully used by many customers in their qualification processes, notably in the avionics and automotive industries.
StackAnalyzer is also available as an integral part of the SCADE development environment, which is DO-178B and DO-178C qualified up to level A for Military and Aerospace Industries, IEC 61508 certified at SIL 3 by TÜV for Heavy Equipment and Energy, and EN 50128 certified at SIL 4 by TÜV for Rail Transportation. Within SCADE, you’ll find the tool under the name “Timing and Stack Optimizer”.
Free 30-day trial
Request your free trial package today, complete with free training and support.
.jpg)